Ultimate Guide To Visual Dashboards

Visual Dashboards: Unveiling Data-Driven Clarity
At Makoboard, we understand that the essence of a visual dashboard lies in its ability to transform complex data into actionable insights. By presenting data in an easily digestible format, dashboards empower you to make informed decisions swiftly and confidently.
Transforming Complexity into Actionable Insights
Visual dashboards serve as a beacon, guiding you through the sea of data to uncover valuable insights. They simplify the complexity by displaying key performance indicators (KPIs) and metrics through intuitive visualizations like graphs and charts. This allows you to grasp the nuances of your data at a glance and respond proactively to emerging trends and patterns.
Core Benefits for Real-Time Decision-Making
The real-time nature of our dashboards ensures that you're always a step ahead. With up-to-the-minute data, you can make decisions that reflect the current state of your business, not yesterday's news. This immediacy is crucial for adapting to the fast-paced market and maintaining a competitive edge.
Enhancing Clarity and Tracking
Clarity is at the heart of our dashboard design. We strive to present data in a way that is not only visually appealing but also meaningful and straightforward. This clarity enables you to track your business's progress with precision, ensuring that no detail is overlooked.
Design Contribution to Quick Decisions
Our dashboards are crafted with the user in mind, featuring a balance of aesthetics and functionality. The design emphasizes ease of use, allowing you to navigate through complex data with ease. This thoughtful design contributes to quicker, more informed decision-making, as you can focus on analysis rather than interpretation.
By leveraging the power of visual dashboards, you're equipped to turn raw data into a strategic asset. With Makoboard, you're not just observing data; you're engaging with it to drive your business forward.
Crafting the Core of Your Dashboard
At Makoboard, we understand that the foundation of an effective dashboard lies in its ability to present information in a clear and actionable manner. To achieve this, certain elements are indispensable.
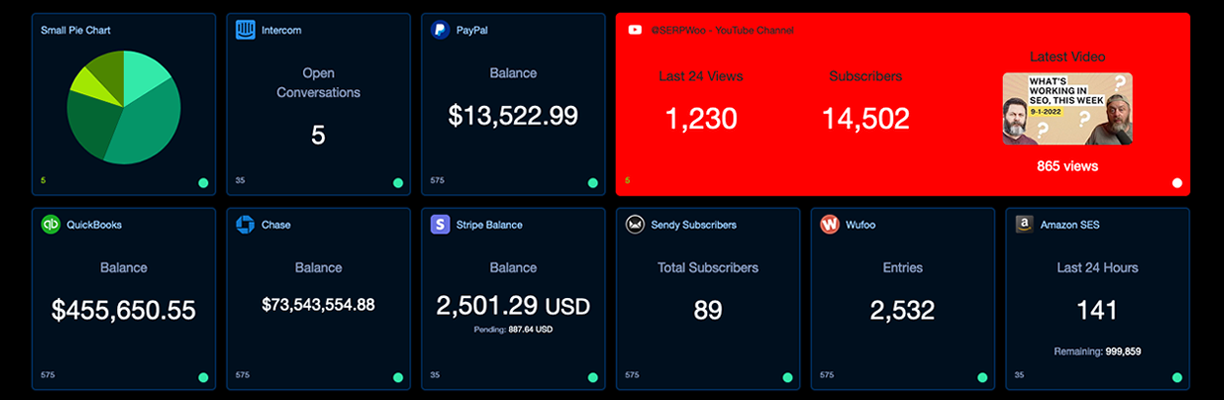
Essential Components for Informative Dashboards
Widgets, Metrics, and Interactivity: The synergy of these elements is what makes a dashboard not just visually appealing, but also functionally robust. Widgets serve as the building blocks, allowing you to display different types of data, while metrics are the quantifiable measures that provide the insights you're seeking. Interactivity enhances user engagement, enabling you to drill down into the specifics and analyze the data at a granular level.
Customization and Templates: Personalizing Your Data Experience
We believe that your dashboard should reflect your business's unique identity and needs. Customization options allow you to tailor the look and feel of your dashboard, aligning it with your brand and the specific KPIs you wish to monitor. Templates offer a starting point, simplifying the creation process while still providing the flexibility to modify and adapt as needed.
Ensuring Clarity and Usability
Your dashboard's usability is paramount. It's not just about the data presented, but how easily you can interpret and act on it. We prioritize design principles that maintain simplicity and clarity, ensuring that the dashboards you create with our tools remain intuitive and accessible for all users within your organization, regardless of their technical expertise.
Streamlining Data Integration with Makoboard
In today's data-driven landscape, the ability to consolidate information from diverse sources into a single, coherent dashboard is invaluable. At Makoboard, we facilitate this integration, ensuring that you have a centralized view of your operations.
Centralizing Data for Operational Excellence
The Power of One: By integrating various data sources into a single dashboard, you're not just simplifying the data visualization process; you're empowering your decision-making. A centralized data source provides a unified view that is crucial for operational management, allowing you to spot trends, identify issues, and take action with confidence.
Handling Diverse Business Applications
Versatility in Data Handling: Our dashboards are designed to accommodate data from a multitude of business applications. Whether you're pulling in metrics from CRM systems, financial platforms, or marketing tools, Makoboard ensures that your data is not only collected but also presented in a way that makes sense for your business.
Selecting the Right Tools for Integration
Making Informed Choices: When you're choosing dashboard tools for data integration, consider not just the breadth of data sources but also the depth of insights you require. With Makoboard, you have the flexibility to select and customize widgets that resonate with your business objectives, ensuring that every piece of data on your dashboard serves a purpose.
Harnessing Real-Time Data for Swift Decision-Making
In the fast-paced business world, the ability to make quick, informed decisions is a game-changer. Our dashboards at Makoboard are engineered to provide you with real-time data, ensuring that you're always a step ahead.

Key Features for Real-Time Monitoring
When it comes to real-time data tracking, operation managers should look for:
- Instantaneous Updates: Dashboards that refresh data automatically, giving you the most current information at a glance.
- Alerts and Notifications: Customizable alerts that notify you when key metrics hit certain thresholds, so you can act promptly.
- Interactive Data Points: The ability to interact with data in real-time, drilling down to the root of any changes or anomalies.
Empowering Startups with Dynamic Dashboards
For startups, agility is key. Real-time dashboards offer:
- Adaptability: The ability to pivot quickly based on the latest data trends.
- Growth Tracking: Monitor the immediate impact of new strategies or campaigns.
Advantages of Real-Time Visualization
Real-time data visualization translates into:
- Proactive Operations: Spot and address issues before they escalate.
- Informed Adjustments: Make data-backed decisions that align with your business's current state, not yesterday's news.
By leveraging the dynamic capabilities of Makoboard's visual dashboards, you're equipped to make decisions that are not just timely but also deeply informed by the latest data at your fingertips.
Personalizing Dashboards to Reflect Your Business Identity
At Makoboard, we recognize that your dashboard should be as unique as your business. That's why we offer extensive customization options to ensure that your dashboard aligns perfectly with your business objectives and brand identity.
Critical Customization Options for Business Alignment
Tailoring to Business Goals: You can customize your dashboard to focus on the KPIs that matter most to your business, ensuring that every metric displayed serves a strategic purpose. This alignment with business objectives is critical for maintaining a clear vision of your company's performance.
Brand Personalization in Dashboard Design
Reflecting Your Brand Aesthetics: With our customization features, you can incorporate your brand's colors, logos, and design elements into your dashboard. This not only reinforces brand identity but also creates a more engaging experience for you and your stakeholders.
Arranging KPIs for Business Process Optimization
Strategic KPI Placement: By arranging KPIs in a way that mirrors your business processes, you gain the ability to monitor and manage your operations more effectively. This strategic placement can lead to enhanced understanding and quicker decision-making.
Leveraging Customization for Unique Business Insights
Insights for Startups and Entrepreneurs: Customization is particularly beneficial for startups and entrepreneurs, as it allows for the creation of dashboards that highlight unique business insights, fostering innovation and driving growth. With Makoboard, you have the tools to tailor your data visualization to your specific journey.
Ensuring Dashboard Security and Collaborative Efficiency
In the digital age, safeguarding sensitive business data is paramount. At Makoboard, we prioritize robust security measures to protect your dashboards, while also fostering a collaborative environment that enhances workflow efficiency.

Implementing Strong Security Protocols
Protecting Your Data: To ensure the security of your data within dashboards, we implement:
- Single Sign-On (SSO): Streamlines the authentication process while maintaining high security standards.
- Two-Factor Authentication: Adds an extra layer of security, verifying user identities through multiple methods.
Facilitating Secure Collaboration
Teamwork Without Compromise: We understand the importance of collaboration in today's business environment. Our dashboards are designed to:
- Allow real-time input from team members, fostering a dynamic and responsive work culture.
- Enable secure sharing of dashboards, ensuring that sensitive information is only accessible to authorized personnel.
Best Practices for Data Security and Real-Time Input
Balancing Security with Accessibility: To maintain data security while enabling real-time input, we recommend:
- Regularly reviewing access logs to monitor dashboard interactions.
- Implementing role-based access controls to ensure that team members only see the data relevant to their responsibilities.
The Impact of Secure Collaboration on Workflow
Enhancing Efficiency: Secure collaboration tools not only protect your data but also contribute to:
Streamlining the decision-making process, as team members can work together seamlessly.
Improving the overall workflow, as data is shared and updated in a controlled and secure manner.
By integrating these security and collaboration features, Makoboard ensures that your dashboards are not just powerful data visualization tools but also secure platforms for collective business intelligence.
Tailoring Dashboards to Industry Demands
At Makoboard, we recognize that each industry has its unique set of challenges and KPIs. Our dashboards are designed to be versatile, catering to the specific needs of sectors ranging from healthcare to retail.

Industry-Specific KPIs and Metrics
Identifying What Matters Most: Different industries focus on various KPIs that are critical to their success. For instance:
- In healthcare, patient satisfaction scores and treatment efficacy rates are paramount.
- Retail businesses prioritize inventory turnover and sales per square foot.
Leveraging Dashboards for Performance Tracking
Optimizing Operations Across Sectors: Operation managers can utilize dashboards to:
- Monitor real-time performance against industry benchmarks.
- Quickly identify areas for improvement and act to enhance efficiency.
Navigating Industry Challenges with Dashboards
Overcoming Sector-Specific Hurdles: Each industry faces unique challenges in dashboard implementation, such as:
- Adhering to strict privacy regulations in healthcare.
- Managing the high volume of transactions in retail.
By understanding these industry-specific needs, we at Makoboard ensure that you're equipped with a dashboard that not only tracks the right metrics but also addresses the particular challenges of your sector.
Tracing the Evolution of Business Intelligence Dashboards
The journey of business intelligence (BI) dashboards is a testament to the advancements in data processing and visualization technologies. From their inception to the interactive platforms we offer at Makoboard, dashboards have undergone a significant transformation.
From Static Charts to Interactive Tools
In the early days, dashboards were static, offering limited interaction and often requiring manual updates. Today, we provide you with:
- Dynamic Interactivity: Dashboards that allow you to interact with your data in real-time, offering drill-down capabilities for detailed analysis.
- Automated Updates: Real-time data feeds that keep your dashboard current without the need for manual intervention.
Milestones in Dashboard Technology
Historical developments that have shaped the landscape include:
- 1970s Decision-Support Systems: The groundwork for BI dashboards, focusing on data analysis for management decision-making.
- 1980s Executive Information Systems: Introduced user-friendly interfaces for high-level executives.
- 1990s BI Software: Began the shift towards more sophisticated data analysis tools.
- 2000s Self-Service BI: Empowered users to create and manage their own dashboards without IT assistance.
The Impact of Self-Service BI
The move towards self-service BI has democratized data analysis, allowing you to:
- Gain Independence: Create and customize dashboards without specialized technical skills.
- Increase Agility: Quickly adapt dashboards to changing business needs.
Learning from the Past for Future Success
Understanding the evolution of dashboards can inform current practices by:
- Highlighting the importance of user-centric design.
- Emphasizing the need for flexibility and scalability in dashboard tools.
At Makoboard, we draw on these historical insights to ensure our dashboards meet the ever-evolving needs of businesses like yours.
Principles of Impactful Dashboard Design
When designing dashboards, our goal at Makoboard is to merge aesthetic appeal with functional clarity, ensuring that the end product is not only visually engaging but also rich in business insights.
Balancing Aesthetics and Functionality
Harmonizing Visuals with Data: It's crucial to strike the right balance between a visually appealing interface and the dashboard's functional purpose. We recommend:
- Using color coding judiciously to highlight important metrics without overwhelming the user.
- Choosing fonts and layouts that enhance readability and facilitate quick comprehension of data.
Avoiding Common Design Pitfalls
Design with Purpose: To avoid common design pitfalls, consider the following:
- Overcrowding: Resist the temptation to display every possible metric. Prioritize data that drives decision-making.
- Complexity: Simplify where possible. Complex visualizations can obscure insights rather than illuminate them.
Crafting Engaging and Informative Dashboards
Engagement Through Clarity: Operation managers can ensure their dashboards are both engaging and informative by:
- Incorporating interactive elements that allow users to explore data layers without cluttering the main view.
- Providing contextual information such as tooltips or legends that help interpret the data accurately.
By adhering to these design principles, we at Makoboard ensure that your dashboards not only capture attention but also deliver the insights necessary for informed business decisions.
Navigating the Financial Aspects of Dashboard Implementation
Understanding the financial implications is crucial when adopting visual dashboards. At Makoboard, we aim to provide you with a transparent overview of the costs and maintenance requirements, ensuring that you can make an informed decision that aligns with your business's financial planning.
Assessing Dashboard Deployment Costs
Initial Investment Insights: The cost of deploying a visual dashboard can vary based on several factors, including:
- The complexity of the dashboard.
- The level of customization required.
- The number of integrations with other systems.
Financial Strategies for Startups
Budgeting for Innovation: For startups, managing the investment in dashboard technology is about balancing cost with value. We suggest:
Starting with our free platform tier to build foundational dashboards.
Gradually scaling up as your business needs grow and become more complex.
Minimizing Maintenance Overheads
Cost-Efficient Maintenance: To minimize the challenges of ongoing maintenance, consider:
- Opting for dashboards that require minimal technical upkeep.
- Leveraging automated features that reduce the need for manual intervention.
Maximizing ROI for Operation Managers
Ensuring Value for Money: Operation managers can ensure a high return on investment by:
- Focusing on dashboards that deliver actionable insights leading to cost savings or revenue generation.
- Regularly reviewing dashboard performance to align with evolving business goals.
By carefully considering these financial aspects, you can leverage Makoboard's visual dashboards to their full potential while maintaining fiscal responsibility.
Selecting the Ideal Dashboard Creation Tools
When it comes to choosing the right dashboard tools, businesses must weigh several considerations. At Makoboard, we guide you through this process, ensuring that the tools you select not only meet your current needs but also adapt to your business's future growth.
Comparing Top Dashboard Vendors
Evaluating Market Leaders: It's important to compare how different vendors cater to your needs. For instance:
- Tableau is renowned for its powerful data visualization capabilities and is particularly well-suited for handling large datasets.
- Power BI offers deep integration with other Microsoft products, making it a go-to for those already within the Microsoft ecosystem.
- Zoho Analytics provides a user-friendly interface with strong CRM and accounting integrations, ideal for businesses that prioritize ease of use.
Unique Features of Dashboard Tools
Identifying Distinct Advantages: Each dashboard tool comes with unique features that can benefit your business:
- Customization and Scalability: Look for tools that offer extensive customization options and can scale with your business.
- Integration Capabilities: Assess the ease with which the tool integrates with your existing systems and data sources.
Assessing Long-Term Vendor Value
Planning for the Future: To determine the long-term value of a dashboard vendor, consider:
- Support and Training: The level of customer support and training resources available can be crucial for long-term success.
- Community and Resources: A strong user community and a wealth of online resources can enhance the tool's value over time.
By carefully considering these factors, you can choose a dashboard tool that not only fits your current needs but also supports your business as it evolves.
Partnering with Makoboard for Data Visualization Excellence
At Makoboard, we're committed to helping you harness the power of data visualization. Our platform is designed to empower your business with the tools and support needed to create impactful visual dashboards.
Comprehensive Support for Dashboard Implementation
Guidance Every Step of the Way: When you choose Makoboard, you're not just getting a dashboard tool; you're gaining a partner. We offer:
- Expert Consultation: Our team is ready to help you define your data visualization goals and identify the best strategies to achieve them.
- Technical Support: From setup to maintenance, our technical support team is on hand to ensure your dashboards run smoothly.
Seamless Dashboard Integration with Makoboard
A Smooth Transition: Partnering with us means a hassle-free integration experience. We ensure:
- Compatibility Checks: Our platform is designed to work seamlessly with your existing systems, minimizing disruptions.
- Custom Integration Solutions: If you have unique requirements, we're here to develop tailored integration strategies.
Getting Started with Makoboard
Your First Steps: To begin your journey with Makoboard, we recommend:
- Identifying Your Key Metrics: Determine the most important data points for your business.
- Exploring Our Platform: Sign up for a free trial to get a feel for our dashboard capabilities.
- Reaching Out: Contact our team for a personalized walkthrough of our services.
By taking these initial steps, you're on your way to unlocking the full potential of your business data with Makoboard.