Ultimate Guide To KPI Dashboards

Understanding KPI Dashboards and Their Impact
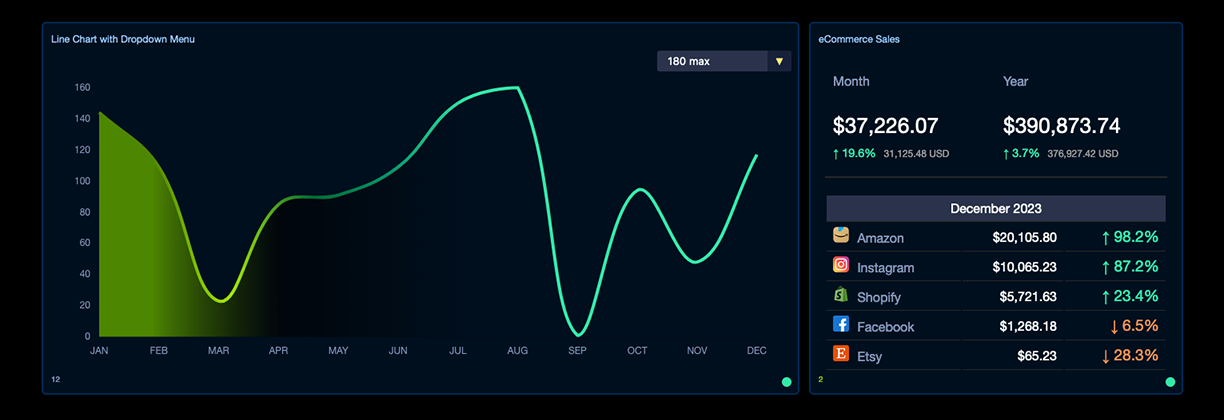
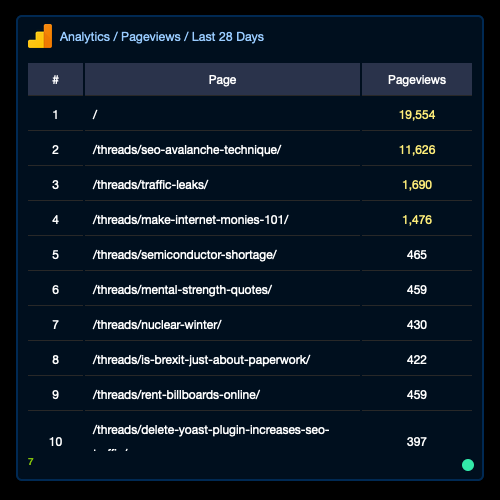
KPI dashboards are powerful tools that transform complex data into actionable insights. By aggregating and visualizing key performance indicators (KPIs), these dashboards enable you to quickly grasp the health and trajectory of your business. Real-time data representation is not just a convenience; it's a strategic asset. It allows for swift decision-making, ensuring that your strategies are informed by the latest information.
Real-Time Data for Strategic Decision-Making
Why Real-Time Visualization Matters: In a fast-paced business environment, the ability to access up-to-the-minute data is crucial. Real-time visual data representations on KPI dashboards provide you with immediate insights, enabling you to make strategic decisions proactively rather than reactively.
Enhancing Operational Efficiency
Operational Efficiency and Accountability: KPI dashboards do more than just display data; they enhance operational efficiency by highlighting areas of strength and pinpointing inefficiencies. This level of insight fosters individual accountability, as employees can see the direct impact of their actions on the company's performance.
Customizing Dashboards for Unique Business Needs
Tailoring to Your Business: We understand that each business is unique. That's why our KPI dashboards, including those powered by Makoboard, offer extensive customization options. Whether you need to track specific metrics for your industry or want to align the dashboard with your company's branding, we provide the tools to create a dashboard that fits your specific requirements. By leveraging the power of KPI dashboards, you're not just collecting data; you're harnessing it to drive your business forward.
The Role of KPIs in Business Strategy and Growth
Understanding the distinct roles of various types of Key Performance Indicators (KPIs) is essential for aligning them with your business's strategic vision and operational mechanics. At Makoboard, we emphasize the importance of differentiating between strategic, operational, and individual KPIs to ensure a comprehensive approach to your business's performance management.
Strategic vs. Operational vs. Individual KPIs
Strategic KPIs are high-level metrics that reflect the overall health and long-term objectives of your business. They are often related to market expansion, revenue growth, and other big-picture goals. Operational KPIs, on the other hand, focus on the efficiency of day-to-day business processes, such as production rates or customer service response times. Individual KPIs drill down further to measure the performance and productivity of each team member, directly tying into appraisals and accountability.
Integrating KPIs into Business Planning
To integrate KPIs into your business planning effectively, it's crucial to ensure they are quantifiable and aligned with your strategic goals. This alignment allows you to track progress and make data-driven decisions that drive your business forward. Customizable KPIs enable you to adapt metrics to fit the unique aspects of your business, ensuring relevance and actionability.
Leveraging Power BI for Enhanced Insights
With tools like Microsoft Power BI, you can delve deeper into your data, uncovering insights that might otherwise remain hidden. Power BI's advanced analytics capabilities allow you to visualize complex data, identify trends, and make predictive analyses. By leveraging these insights, you can refine your KPI strategies, making them more effective and responsive to your business's needs. Remember, the key to successful KPI management is to select metrics that are not only measurable and aligned with your objectives but also capable of driving meaningful action.
Selecting the Right Metrics for Your Dashboard
Choosing the right metrics is a pivotal step in harnessing the full potential of KPI dashboards. With over 50 suggested metrics to consider, it's crucial to select those that align closely with your business objectives and can significantly impact your decision-making process.
Critical Metrics for Business Performance
At Makoboard, we understand that every business is unique, and so should be the metrics you track. Customer Acquisition Cost (CAC) and Customer Lifetime Value (CLV) are common yet powerful metrics that can provide insights into the profitability and sustainability of your customer acquisition strategies. By balancing the cost of acquiring new customers against the revenue they generate over time, you can make informed decisions about where to allocate your marketing budget for maximum return on investment.
User Interest vs. Conversion Rates
Tracking both user interest and conversion rates sheds light on the effectiveness of your sales funnel. While user interest indicates the potential market size and the appeal of your product, conversion rates tell you how well your business is capturing that interest. This dual tracking allows you to fine-tune your marketing efforts and improve the customer journey.
Effective Management and Tracking
To manage and track these key metrics effectively, you need a robust system in place. Our platform provides you with the tools to not only monitor these metrics in real-time but also to customize your dashboard to reflect the KPIs most relevant to your business. With Makoboard, you're empowered to make data-driven decisions that propel your business forward.
Dashboard Types to Suit Every Business Need
Selecting the right KPI dashboard is pivotal for any business role, as it provides targeted insights and drives informed decision-making. At Makoboard, we offer a variety of dashboard types designed to cater to the specific needs of different business functions.
CEO Dashboards for a Comprehensive Business View
For CEOs and top-level executives, our CEO dashboards are engineered to provide a holistic view of business health. They aggregate key strategic metrics from various departments, offering a high-level perspective that is essential for long-term planning and decision-making. With this dashboard, you're equipped to see the big picture and guide your company towards its overarching goals.
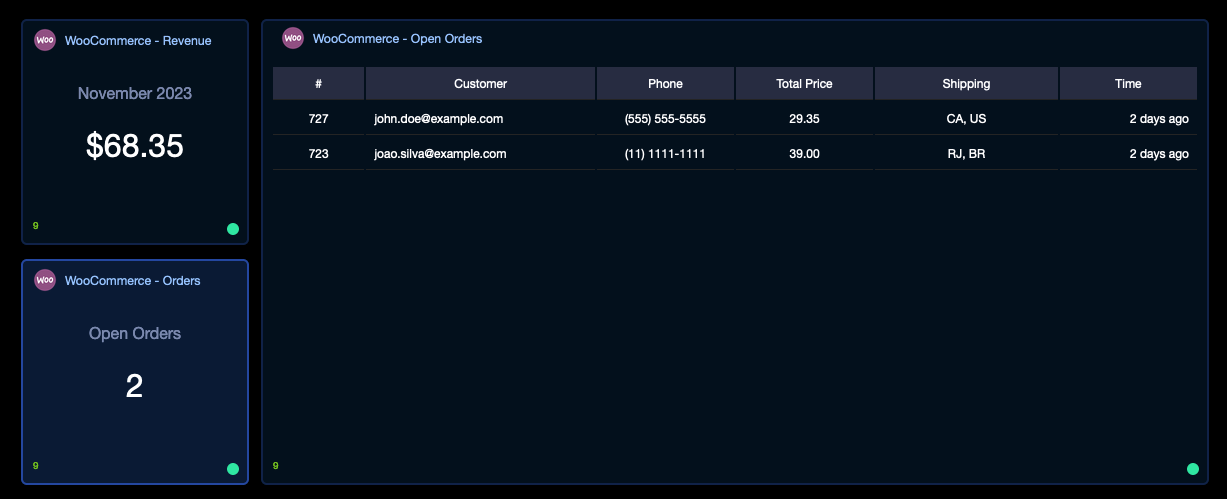
Operational and Marketing Dashboards: Focus and Functionality
Operational dashboards are tailored to monitor the efficiency of daily business activities, helping managers to optimize processes and resources. In contrast, marketing dashboards focus on team performance metrics, campaign results, and customer engagement data, enabling marketers to adjust strategies for better ROI.
The Importance of KPI Dashboards for Early-Stage SaaS Companies
Early-stage SaaS companies should pay particular attention to their KPI dashboard selection. The right dashboard can highlight valuable KPIs that are crucial for growth, such as user acquisition costs, churn rates, and recurring revenue. By focusing on these metrics, SaaS startups can navigate the challenges of scaling effectively and sustainably.
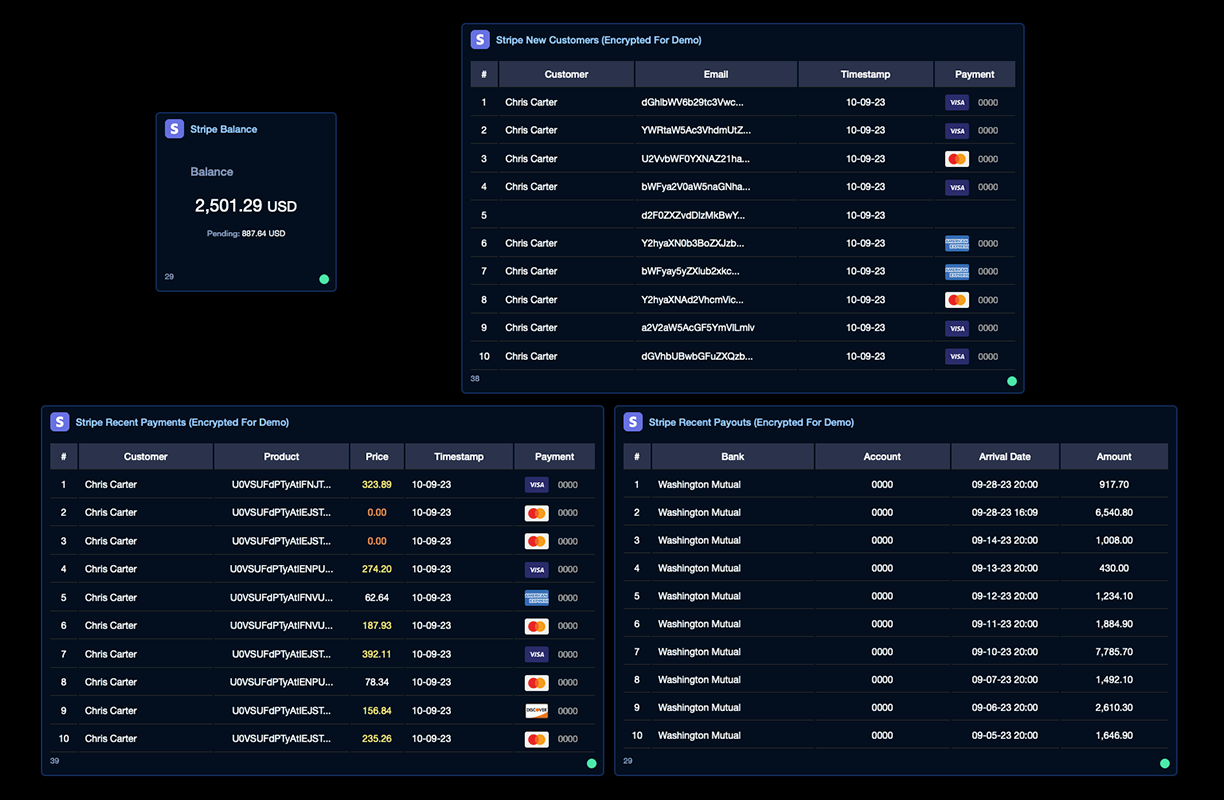
Integrating Advanced Software Solutions for Robust Reporting
The integration of advanced software solutions is key to robust reporting and insightful KPI tracking. At Makoboard, we've curated a suite of specialized dashboard software options to ensure that you have access to comprehensive reporting tools that cater to your unique business needs.
Specialized Dashboard Software Options
Our platform supports a range of specialized software, including Hive, Google Analytics, Klipfolio, Tableau, and Scoro. These tools are designed to provide you with a seamless experience in monitoring, analyzing, and visualizing your data.
Enhancing KPI Tracking with Hive and Google Analytics
With Makoboard, you can streamline project management and track operational KPIs effectively. Google Analytics offers deep insights into your website's traffic and user behavior, enhancing your marketing KPIs with rich data and trend analysis.
Benefits of Klipfolio, Tableau, and Scoro
Makoboard empowers you with customizable dashboards and automated reporting, while Tableau excels in data visualization, helping you to see and understand your data in new ways. Scoro provides an all-in-one business management software solution, ensuring that your operational dashboards are comprehensive and actionable.
Choosing the Right Reporting Tools
When deciding between multiple reporting tools and embedded analytics, consider your business's specific reporting needs and the level of customization required. Our team at Makoboard is here to guide you through the selection process, ensuring that you choose the tools that will best support your decision-making and strategic planning.
Achieving a Competitive Edge with KPI Dashboard Benefits
In the dynamic business environment, KPI dashboards serve as a linchpin for companies aiming to streamline complex processes and gain a competitive edge. At Makoboard, we've seen firsthand how the strategic implementation of dashboards can transform a business's approach to data analysis and decision-making.
Simplifying Business Processes
KPI dashboards act as a catalyst for simplifying complex business processes. By providing a centralized platform for data, our dashboards enable you to quickly identify trends, pinpoint inefficiencies, and make informed decisions without sifting through disparate data sources. This consolidation of information not only saves time but also ensures that you're working with a coherent and complete data set.
Cost and Time Efficiency
Time is a precious commodity in business, and efficiency is often directly tied to cost savings. With KPI dashboards, you can automate the reporting process, reducing the need for manual data compilation and analysis. This automation translates into significant time savings for your team, allowing you to allocate resources more effectively and reduce operational costs.
Optimizing Resource Allocation
Resource allocation is a critical aspect of business management. Our dashboards provide you with actionable insights that inform resource distribution, ensuring that you're investing in areas with the highest return potential. By optimizing resource allocation, you're not only maximizing efficiency but also enhancing your company's agility and responsiveness to market changes.
Translating Insights into Competitive Advantage
The actionable insights gleaned from KPI dashboards are more than just numbers, they're a roadmap to business success. By leveraging these insights, you can make strategic decisions that propel your company ahead of the competition. Whether it's refining your marketing strategy or improving customer satisfaction, the data-driven decisions you make today will define your competitive position tomorrow.
Harnessing AI and Machine Learning in KPI Dashboards
KPI dashboard analytics, artificial intelligence (AI) and machine learning are game-changers. At Makoboard, we integrate these technologies to transform raw data into predictive insights, offering you a more intelligent approach to business strategy.

Revolutionizing Analytics with AI
AI algorithms sift through vast amounts of data, identifying patterns and anomalies that might escape human analysis. This capability means that our dashboards not only report on what has happened but also predict what could happen, giving you a proactive stance in managing your business.
Predictive Analytics: A Strategic Asset
Predictive analytics is at the forefront of strategic planning. By analyzing historical data and current trends, it forecasts future events with a remarkable degree of accuracy. This foresight allows you to anticipate market changes, customer behavior, and potential risks, ensuring that your strategic plans are both resilient and dynamic.
The Necessity of Real-Time Data
In today's fast-paced business environment, real-time data updates are not a luxurythey're a necessity. Static reports become outdated quickly, but with our real-time dashboards, you're always informed with the latest data, enabling swift and informed decision-making.
Data Warehousing: Enhancing Dashboard Capabilities
A robust data warehouse acts as the backbone of an effective KPI dashboard. It consolidates data from disparate sources, providing a unified repository that enhances data quality and accessibility. With Makoboard, you can leverage this integration to ensure that your dashboard reflects a complete and accurate view of your business performance.
Enhancing Departmental Synergy with Unified Dashboards
In the collaborative spirit of modern business, KPI dashboards are more than just tools for individual departments; they are the nexus of inter-departmental communication and decision-making. At Makoboard, we've seen how unified dashboards can foster a culture of transparency and collective responsibility.
Aligned Decision-Making Through Centralized Data
Our dashboards support aligned organizational decision-making by providing a single source of truth. When you have access to consistent and reliable data across all departments, you're able to make decisions that consider the broader implications for your business.
The Single-Screen Advantage
A single-screen view is more than a convenience, it's a catalyst for efficiency. With all critical data points accessible at a glance, you can share information swiftly, ensuring that every team member is on the same page, which is vital for fast-paced business environments.
Instant Reporting for Enhanced Collaboration
The ability to generate reports instantly is a cornerstone of effective departmental collaboration. It allows for the rapid dissemination of insights, enabling teams to respond to new information in real-time and adjust their strategies accordingly.
Best Practices for Data Integrity
Maintaining data accuracy and reliability is non-negotiable. To ensure the integrity of your data across departments, we recommend:
- Regular data audits to identify and correct discrepancies
- Clear data entry and management protocols
- Ongoing training for team members on data handling best practices
By adhering to these principles, you can trust that the insights you derive from your KPI dashboards are both accurate and actionable.
Designing Dashboards for Maximum Effectiveness
Creating an effective KPI dashboard is both an art and a science. It requires a balance between aesthetic appeal and functional clarity. At Makoboard, we guide you through the design process to ensure your dashboard is not only visually engaging but also strategically aligned with your business objectives.
Core Design Principles for KPI Dashboards
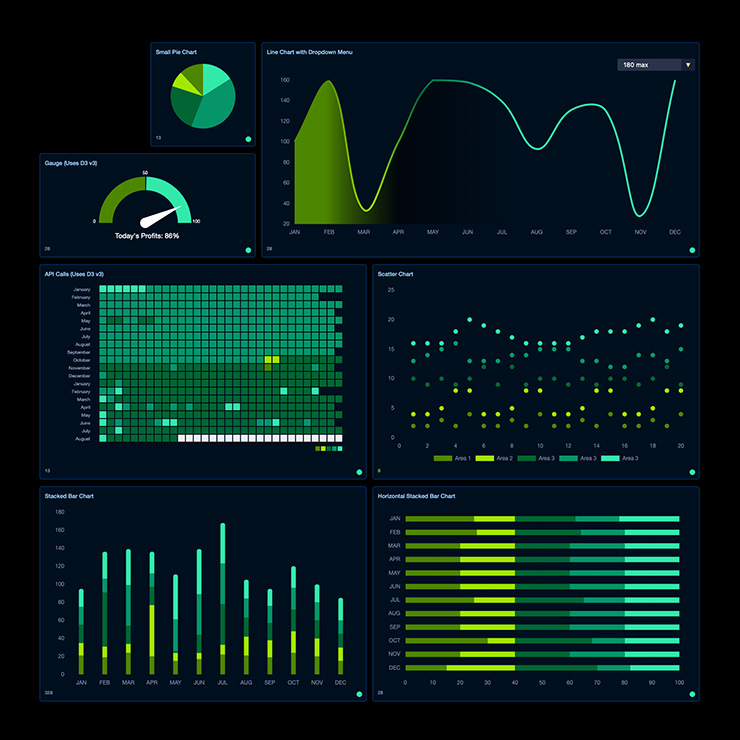
When designing your dashboard, we focus on several core principles: Conciseness: We aim for a clean layout that presents the most important information at a glance, avoiding clutter that can distract from key data. Visual Impact: Our use of charts, graphs, and color coding is intentional, enhancing the ability to quickly interpret data trends and variances. Objective-Driven: Each element on your dashboard is chosen to support specific business objectives, ensuring every metric displayed serves a purpose.
Avoiding Vanity Metrics
It's crucial to differentiate between vanity metrics, which may look impressive but offer little actionable value, and actionable KPIs that directly influence decision-making. We help you focus on metrics that matter, those that directly affect your business's performance and goals.
The Importance of Regular Reviews
Regular review cycles are integral to maintaining dashboard effectiveness. They ensure that your KPIs remain relevant and that the data quality is upheld. We encourage periodic assessments to refine your dashboard, keeping it aligned with evolving business strategies and market conditions.
By adhering to these design principles, your KPI dashboard becomes a powerful tool in your business intelligence arsenal, driving informed decisions and strategic actions.
Building KPIs That Drive Business Success
Crafting effective Key Performance Indicators (KPIs) is a strategic endeavor that requires thoughtful consideration of your business's goals and the actions needed to achieve them. At Makoboard, we provide the tools and guidance to ensure your KPIs are not just numbers, but catalysts for growth and success.
Setting Objectives and Measures
When establishing KPIs, it's essential to:
- Define clear objectives that align with your strategic goals.
- Choose measures that are quantifiable, allowing for precise tracking and analysis.
- Ensure that each KPI has a direct link to the outcomes you want to influence.
Reviewing KPI Targets and Data Sources
To maintain the relevance of your KPIs, we recommend:
- Conducting reviews quarterly to adapt to market changes and internal shifts.
- Evaluating the data sources for accuracy and consistency, ensuring reliable metrics.
Ownership of KPI Tracking
KPI management should be assigned to:
- Individuals or teams with the authority and resources to influence the measured outcomes.
- Roles that have a comprehensive understanding of the context and impact of the KPIs.
Aligning KPIs with Strategic Goals
To align KPIs with your business strategy, ensure that:
- Each KPI is a reflection of your strategic priorities.
- The KPIs are communicated across the organization, fostering a shared understanding of their importance.
By following these guidelines, you can create a KPI framework that not only measures performance but actively drives your business towards its strategic objectives.
Dashboard Creation Versus Traditional Reporting
In the digital age, the way we interpret and utilize business data has evolved. KPI dashboards and traditional reports serve distinct, yet complementary roles in this landscape. Understanding their differences and synergies is key to leveraging both for strategic advantage.
Dashboards: At-a-Glance Business Health Assessments
Dashboards are preferred for their ability to provide a snapshot of your business's health. They offer:
- Real-time data visualization, allowing for immediate insight into performance metrics.
- Interactive elements that enable you to drill down into specific data points for deeper analysis.
Complementing Dashboards with Detailed Reports
While dashboards give you a quick overview, detailed reports are invaluable for their depth and context. They:
- Provide comprehensive data analysis, which is essential for understanding complex issues.
- Serve as a record of performance over time, helping you track progress and trends.
Generating KPI Reports to Support Dashboard Data
To generate KPI reports that complement your dashboard data, we recommend:
- Establishing a regular reporting schedule to maintain up-to-date records.
- Using data export features within Makoboard to seamlessly create detailed reports.
Showcasing Dashboard Effectiveness
To demonstrate the effectiveness of your dashboards, consider:
- Sharing success stories and case studies that highlight the impact of your dashboards.
- Providing interactive demos or gallery examples on our platform, showcasing real-world applications and results.
Enhancing Your KPI Dashboard Experience with Makoboard
When it comes to KPI dashboards, the clarity of data visualization is paramount. At Makoboard, we pride ourselves on delivering a service that not only presents your data but brings it to life through intuitive and insightful visualizations.
Tailored Setup Guidance and Best Practices
Embarking on the journey of dashboard creation can be daunting, but you're not alone. We provide comprehensive setup guidance, ensuring that your transition to using our dashboards is smooth and stress-free. Our best practices are distilled from years of expertise and are designed to help you maximize the utility of your KPI dashboards.
Continuous Adaptation and Proactive Issue Resolution
The business landscape is ever-changing, and so are your dashboard needs. We stay ahead of the curve by:
- Offering continuous adaptation of your dashboards to meet evolving business requirements.
- Ensuring proactive issue resolution to maintain the integrity and accuracy of your KPI monitoring.
Choosing Makoboard for Customizable and Developer-Friendly Solutions
We understand the need for a dashboard that fits your unique business context. That's why our solutions are:
- Highly customizable, allowing you to tailor your dashboard to your specific needs.
- Developer-friendly, supporting a range of programming languages and integrations.
By choosing Makoboard, you're not just getting a KPI dashboard; you're gaining a dynamic business tool that grows and adapts with you.