Ultimate Guide To Operation Dashboards

Understanding Operation Dashboards
Operation dashboards are dynamic tools designed to enhance real-time decision-making in fast-paced business environments. Unlike strategic or analytical dashboards that focus on long-term trends and data analysis, operation dashboards specialize in the here and now, providing immediate insights that are crucial for day-to-day management.
Real-Time Decision-Making Enhanced
With real-time data integration, operation dashboards offer a live view of your business's operational health. This immediacy allows you to respond swiftly to emerging issues or capitalize on opportunities as they arise, ensuring that your business operations remain agile and efficient.
Distinct Features of Operation Dashboards
What sets operation dashboards apart is their focus on short-term, actionable metrics. They are tailored to monitor and manage ongoing activities, often featuring alerts and issue tracking to facilitate immediate actions. This contrasts with other dashboards that may prioritize historical data or predictive analytics.
Customization for Industry-Specific Needs
At Makoboard, we understand that every industry has unique requirements. That's why our operation dashboards are fully customizable. Whether you're in retail, manufacturing, or any other sector, you can tailor your dashboard to reflect the KPIs that matter most to your business.
The Power of Real-Time Data
Integrating real-time data into operation dashboards transforms how you manage business processes. It enables a proactive approach to operational management, where data-driven decisions are made swiftly, keeping your business processes streamlined and ahead of the curve.
The Role of KPIs in Operation Dashboards
Key Performance Indicators (KPIs) are the lifeblood of operation dashboards, providing you with quantifiable measures of performance that are essential for the day-to-day management of your business. At Makoboard, we understand that the right KPIs can make all the difference in driving your business forward.
Critical KPIs for Effective Monitoring
The most critical KPIs for operation dashboards typically revolve around sales performance, customer satisfaction, and operational efficiency. These can include metrics like:
- Sales revenue
- Customer acquisition costs
- Conversion rates
- Operational downtime
Tracking and Displaying KPIs
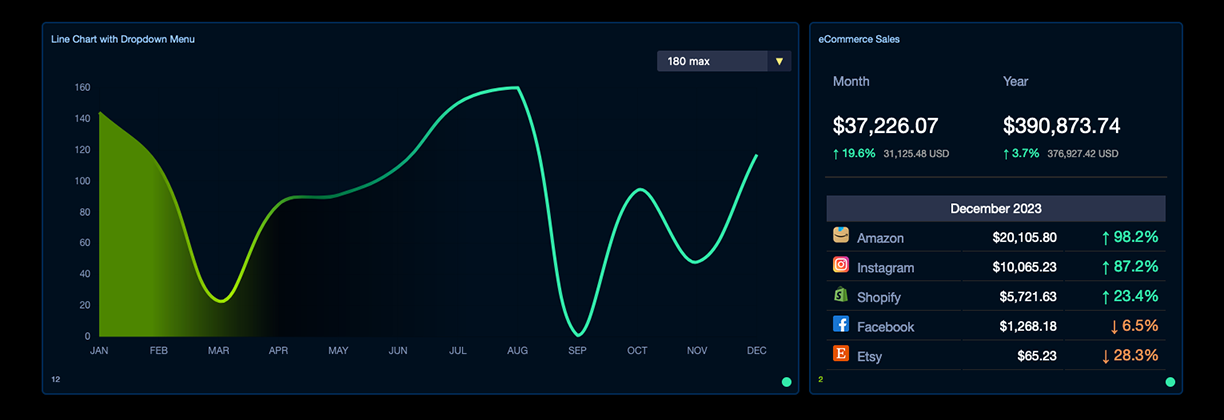
Our operation dashboards are designed to track and display these KPIs effectively, using real-time data feeds to ensure that you're always up-to-date. We employ a variety of data visualization techniques, such as:
-Dynamic charts -Interactive graphs -Customizable gauges
Tailoring Dashboards to Industry Needs
We recognize that each industry has unique needs, which is why our dashboards can be tailored to monitor industry-specific KPIs. Whether you're in retail, manufacturing, or any other sector, we can help you focus on the metrics that matter most to your business.
Driving Actions with KPIs
KPIs on operation dashboards are not just for show; they're actionable. By setting threshold alerts and integrating decision-making tools, our dashboards empower you to take immediate actions based on real-time data, ensuring that your business remains agile and responsive.
Tailoring Your Operational Dashboard
At Makoboard, we believe that a dashboard should be as unique as the business it serves. That's why we offer extensive customization options for your operational dashboards, ensuring that the tool you use is perfectly aligned with your business's specific needs and goals.
Customization Options at Your Fingertips
You have the power to tailor every aspect of your operational dashboard. From selecting the KPIs that are most relevant to your industry to choosing a visual theme that reflects your brand, our customization options include:
- KPI Selection: Choose from a wide array of KPIs to track what's most important to you.
- Visual Themes: Apply Makoboard themes or create your own to match your company's branding.
- Layout Configuration: Arrange dashboard elements to optimize the flow of information.
Engaging Users in the Customization Process
User engagement is crucial in the customization process. We encourage you to involve your team in dashboard design to ensure that it meets everyone's needs and is used to its full potential. Our self-service analytics empower your team members to create personalized views that resonate with their roles and responsibilities.
Makoboard's Support for Customization
Our platform supports a wide range of customization through:
- Self-Service Analytics: Empower users to create and modify dashboards without needing technical expertise.
- Integration Capabilities: Seamlessly integrate with tools like HTML, CSS, JavaScript, and various data sources to enhance functionality.
- MakoCore Apps: Utilize our suite of applications to further customize and extend your dashboard's capabilities.
By providing these tools, we ensure that you're equipped to create an operational dashboard that not only meets your current needs but also evolves with your business.
Visualizing Data for Maximum Impact
Effective data visualization is a cornerstone of operational dashboards, transforming complex datasets into clear, actionable insights. At Makoboard, we harness the most effective visualization techniques to ensure that you can quickly comprehend and act on your data.
Choosing the Right Visualization Techniques
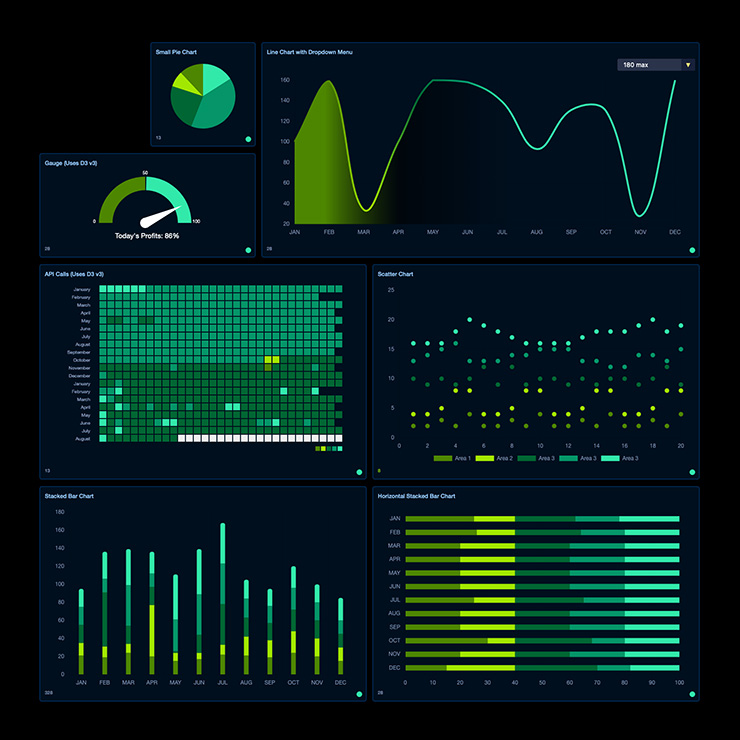
Charts and Graphs: These are the bedrock of data visualization on our dashboards. We utilize:
- Line and bar charts for trend analysis
- Pie charts for market share representation
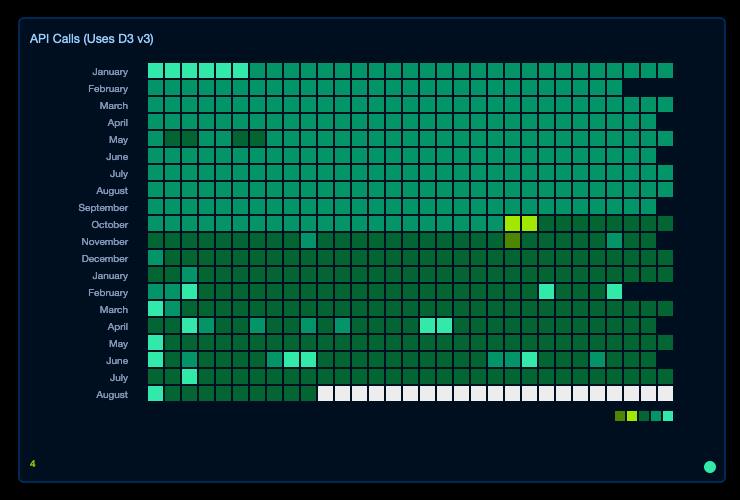
- Heat maps for identifying hot spots in data
Each type is chosen based on its ability to best represent the underlying data and to facilitate quick decision-making.
Principles of Effective Dashboard Design
When visualizing data on operation dashboards, we adhere to key design principles:
- Simplicity: Avoiding clutter and focusing on clarity to make data easily digestible.
- Consistency: Using uniform styles and colors to represent similar data types.
- Relevance: Ensuring every visual element serves a purpose and aligns with your KPIs.
Driving Actionable Insights
Our visualizations are not just about displaying data; they're about driving your business forward. By presenting data in an intuitive format, we help you spot trends, identify issues, and seize opportunities as they arise. This approach ensures that the insights you gain from our dashboards lead to informed, timely actions that can propel your business to new heights.
Real-Time Data: The Backbone of Operational Efficiency
In the fast-paced world of business, real-time data is not just a luxury it's a necessity. At Makoboard, we understand that the ability to access up-to-the-minute information is critical for maintaining operational efficiency and staying ahead of the competition.
Handling Real-Time Data and Alerts
Our operational dashboards are engineered to handle real-time data seamlessly, providing you with instant visibility into your business processes. Here's how we ensure you're always in the know:
- Live Data Feeds: We integrate with various data sources to stream information directly to your dashboard.
- Instant Alerts: Set up custom thresholds to receive notifications for immediate attention.
Impact of Real-Time Information on Efficiency
Real-time data has a profound impact on operational efficiency, enabling you to:
- Monitor Performance: Track live metrics and respond to changes as they happen.
- Optimize Processes: Identify bottlenecks quickly and adjust workflows for better performance.
Ensuring Data Accuracy and Timeliness
To ensure the accuracy and timeliness of the data on your operational dashboards, we:
- Validate Sources: Rigorously check data sources for reliability.
- Update Intervals: Configure refresh rates to suit the criticality of the information.
By prioritizing real-time data, we empower you to make informed decisions swiftly, keeping your operations agile and responsive to the ever-changing business landscape.
Aligning Dashboards with Business Goals
Operational dashboards are not just about presenting data; they are strategic tools that should align with and drive your business goals forward. At Makoboard, we ensure that your dashboards are not only informative but also instrumental in achieving your strategic objectives.
Ensuring Dashboard Relevance to Business Objectives
To guarantee that your operational dashboards are relevant to your business objectives, we:
- Identify Key Goals: Work with you to understand your strategic aims and tailor the dashboard to reflect these priorities.
- Select Appropriate KPIs: Choose metrics that directly impact your business goals to monitor progress effectively.
Facilitating Strategic Communication
Operational dashboards can be pivotal in enhancing communication within your organization by:
- Providing a Unified View: Offering a single source of truth that everyone in the company can refer to.
- Encouraging Collaboration: Enabling different departments to work together towards common objectives highlighted on the dashboard.
Overcoming Challenges in Alignment
Aligning dashboards with business goals can be challenging, but we tackle these head-on by:
- Regular Reviews: Continuously assessing and adjusting dashboards to stay in line with evolving business strategies.
- Flexible Design: Creating dashboards that can be easily modified as goals shift, ensuring long-term alignment.
By focusing on these areas, we help ensure that your operational dashboards are not just a reflection of your business's current state but a catalyst for future growth and success.
Integrating Diverse Data Sources
In today's data-driven landscape, operational dashboards must integrate a variety of data sources to provide a comprehensive view of business performance. At Makoboard, we specialize in synthesizing data from multiple streams to deliver a centralized dashboard that serves as a single source of truth for your organization.

Common Data Sources for Operational Dashboards
Operational dashboards typically integrate data from:
- Sales and Marketing Platforms: Track campaign performance and customer engagement.
- Financial Systems: Monitor revenue, expenses, and other financial KPIs.
- Customer Relationship Management (CRM) Tools: Gain insights into customer interactions and sales pipelines.
- Supply Chain Management Software: Keep an eye on inventory levels, order status, and logistics.
Managing Complexity with Makoboard
To manage the complexity of integrating these diverse data sources, we:
- Automate Data Aggregation: Use advanced algorithms to collect and harmonize data from various systems.
- Ensure Data Integrity: Implement checks to maintain the accuracy and consistency of the information displayed.
Benefits of a Centralized Data View
A centralized view of data offers significant benefits, including:
- Enhanced Decision-Making: Access to unified data allows for more informed and timely decisions.
- Increased Efficiency: Eliminate the need to switch between multiple platforms to gather insights.
Seamless Integration for Your Business
To ensure seamless integration, we:
- Offer Custom Connectors: Create bespoke solutions to link your specific data sources to the dashboard.
- Provide Expert Support: Our team is on hand to guide you through the integration process, ensuring a smooth transition to a more connected data ecosystem.
Selecting the Right BI Tools for Your Dashboard
Choosing the right Business Intelligence (BI) tools is pivotal for the effectiveness of your operational dashboards. At Makoboard, we guide you through the selection process, ensuring that the tools you choose not only meet your current needs but also have the capacity to grow with your business.
Factors to Consider for BI Tool Selection
When selecting BI tools for your operational dashboards, consider the following factors:
- Data Integration: The tool should seamlessly integrate with your existing data sources.
- User-Friendliness: Look for intuitive interfaces that require minimal training.
- Customization: Ensure the tool allows for customization to reflect your unique business processes.
Enhancements Offered by BI Tools
BI tools like Domo and Yellowfin bring a wealth of enhancements to operational dashboards, such as:
- Advanced Analytics: They offer deep insights through predictive analytics and data mining.
- Collaborative Features: These tools facilitate sharing and collaboration across your team.
- Reporting Capabilities: Generate dynamic reports that can inform your strategic decisions.
Expandability in BI Tools
As your business grows, your BI tools should be able to scale with you. Look for:
- Modular Design: The ability to add features or modules as needed.
- API Access: Options for integrating custom applications or third-party services.
BI Tools' Role in Informed Decision-Making
BI tools are instrumental in transforming data into actionable insights, enabling you to:
- Spot Trends: Quickly identify patterns that could impact your business.
- Make Proactive Decisions: Use real-time data to make decisions that keep you ahead of the curve.
By carefully selecting the right BI tools, you ensure that your operational dashboards remain a powerful asset for informed decision-making.
Operational Dashboard Tools and Software
Selecting the right tools and software is crucial for creating operational dashboards that not only reflect real-time business performance but also drive strategic decision-making. At Makoboard, we've curated a suite of leading tools that cater to a diverse range of business needs.
Leading Tools for Diverse Business Requirements
When it comes to operational dashboard tools, there are several market leaders that specialize in different aspects of business intelligence:
- Datapad: Ideal for mobile-friendly, real-time KPI tracking.
- Geckoboard: Known for its big screen displays and data source connectivity.
- Tableau: Offers diverse field data access and advanced monitoring capabilities.
Catering to Your Business Needs
Each tool has its own set of features designed to address specific business requirements:
- Customization: Tools like Makoboard allow for extensive customization with themes and widgets to match your brand.
- Scalability: Platforms such as Klipfolio and Dundas BI scale with your business, offering dynamic and flexible solutions.
Comparing Features and Pricing
When comparing operational dashboard tools, consider:
- Ease of Use: User-friendly interfaces that require minimal training.
- Integration: Seamless integration with your existing data sources and systems.
- Cost: Transparent pricing models that fit your budget without compromising on functionality.
Specialization in Operational Dashboards
Tools like Geckoboard and Tableau are tailored for operational dashboards by offering:
- Real-Time Data: Capabilities to stream live data for up-to-the-minute insights. / Collaboration: Features that enhance team communication and data sharing.
By carefully evaluating these tools, you can select the one that best fits your operational needs and enhances your decision-making processes.
Mobile Dashboards: Monitoring on the Move
In the dynamic world of business, mobile compatibility for operational dashboards is not just a convenience it's a critical component of modern business strategy. At Makoboard, we prioritize mobile accessibility to ensure that you have the power to monitor and manage your operations anytime, anywhere.
Advantages of Mobile-Friendly Dashboard Tools
Datapad, as an example, offers several advantages for on-the-go monitoring:
- Instant Access: Get real-time data at your fingertips, making it easier to make informed decisions quickly.
- User-Friendly Interface: Designed for ease of use on smaller screens without sacrificing functionality.
Facilitating Collaboration Through Mobile Access
Mobile dashboards are designed to enhance team collaboration by:
- Sharing Insights: Quickly disseminate important data points with your team.
- Communication Tools: Utilize in-app messaging and notification systems to keep everyone aligned.
Overcoming Mobile Dashboard Challenges
While mobile dashboards offer numerous benefits, businesses may encounter challenges such as:
- Data Security: Ensuring secure access to company data on mobile devices.
- Screen Size Limitations: Presenting comprehensive data on smaller screens without overwhelming the user.
To address these challenges, we:
- Implement robust security protocols.
- Design dashboards that are responsive and adaptive to various screen sizes.
By leveraging mobile-friendly operational dashboards, you ensure that your business remains agile and responsive, no matter where you are.
Enhancing Business Performance with Operational Dashboards
Operational dashboards are pivotal in tracking sales and assessing business strategies, providing a real-time snapshot of your company's performance. At Makoboard, we've honed our dashboards to be powerful tools for enhancing business efficiency and profitability.
Tracking Sales and Assessing Strategies
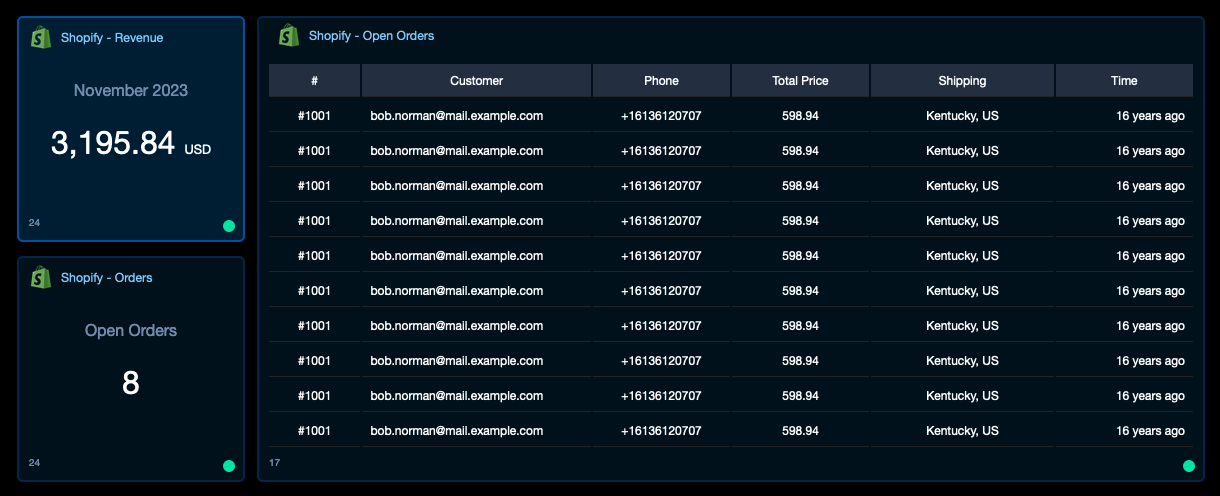
Our operational dashboards offer comprehensive tracking features that allow you to:
- Monitor sales figures in real-time, enabling immediate response to market trends.
- Evaluate the effectiveness of business strategies with data-driven insights.
Role in Business Efficiency and Profitability
Operational dashboards contribute to business efficiency by:
- Streamlining decision-making processes through centralized data.
- Identifying areas for cost reduction and revenue optimization.
Utilizing Dashboards for Performance Improvement
To improve overall business performance with operational dashboards, consider:
- Regularly updating KPIs to reflect evolving business objectives.
- Encouraging team engagement with the dashboard to foster a data-driven culture.
Key Considerations for Maximizing Utility
For businesses to maximize the utility of operational dashboards, it's essential to:
- Ensure data accuracy by integrating reliable data sources.
- Customize dashboards to align with specific business goals and industry requirements.
- Train staff on dashboard usage to enhance adoption and maximize its benefits.
By focusing on these areas, you can leverage the full potential of operational dashboards to drive your business forward.
Partner with Makoboard for Operational Dashboard Excellence
At Makoboard, we specialize in crafting operational dashboards that are not only effective but also integral to the strategic management of your business. Our commitment is to provide you with a dashboard that is a perfect fit for your unique operational needs.
Comprehensive Support and Services
When you choose Makoboard, you're not just getting a dashboard; you're gaining a partner dedicated to your success. We offer:
- Expert Consultation: Our team works with you to understand your specific requirements and goals.
- Customization Assistance: From selecting the right KPIs to choosing the ideal layout, we guide you through every step of the customization process.
Maximizing Dashboard Utility with Makoboard
Partnering with us ensures that you get the most out of your operational dashboards through:
- Continuous Improvement: We provide ongoing support and updates to keep your dashboards performing at their best.
- Training and Resources: Access to comprehensive guides, webinars, and customer support to ensure you are fully equipped to use your dashboard effectively.
Getting Started with Makoboard
To embark on your journey with Makoboard, simply:
- Reach Out: Contact us to discuss your needs and set up an initial consultation.
- Define Your Objectives: Help us understand your business goals to tailor the dashboard to your needs.
Customize and Implement: Work with our team to customize your dashboard and integrate it seamlessly into your operations.
We're here to ensure that your operational dashboards are not just tools, but catalysts for growth and efficiency.